


Imagine a bustling marketplace. Vendors hawk their wares, while buyers search for the best deals. Prices fluctuate as supply and demand constantly dance a delicate tango. This same dynamic plays out in the world of financial markets, though the “marketplace” is virtual and the “vendors” and “buyers” are represented by large institutions and individual traders.
Understanding these forces of supply and demand is crucial for any trader who wants to navigate the ever-shifting currents of the market. But how do you identify these invisible areas where buyers and sellers clash? This is where supply and demand zones come in. These zones, represented on price charts, are like hidden battlegrounds where the price action reveals the underlying struggle between buyers and sellers.
Learning to spot these zones properly can be a game-changer for your trading strategy. This guide will equip you with the knowledge and tools to identify supply and demand zones with confidence, ultimately giving you an edge in the dynamic world of financial markets.
What Are Supply and Demand Zones?
In the realm of financial markets, price movements are driven by a fundamental principle: the constant interplay between supply and demand. Supply refers to the number of units (stocks, currencies, etc.) available for purchase at a given price, while demand represents the willingness of traders to buy those units at that same price.
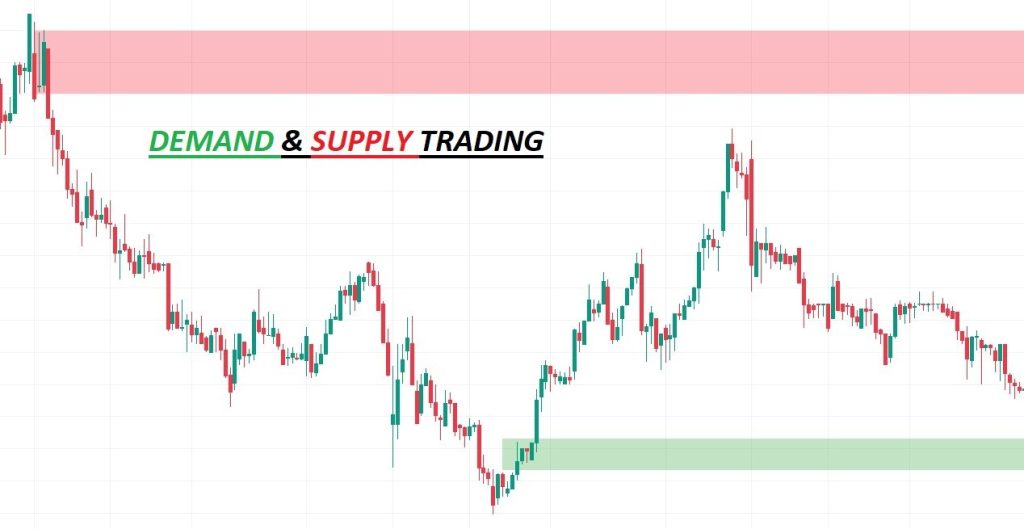
Now, let’s translate this concept onto a price chart. Imagine a horizontal band on the chart where the price has stalled or reversed direction multiple times in the past. This band represents a supply and demand zone.
Here’s how these zones reveal areas of buying and selling pressure:
Supply Zone
This zone forms at the upper end of the band. It signifies a price level where there was an excess of sellers in the past. The price tends to struggle to break above this zone because as the price rises, more sellers are willing to offload their holdings, pushing the price back down. This creates a sense of resistance.
Demand Zone
This zone forms at the lower end of the band. It signifies a price level where there was an excess of buyers in the past. The price tends to find support at this zone because as the price falls, more buyers are willing to step in and purchase, preventing further decline. This creates a sense of support.
Essentially, supply and demand zones represent areas on the chart where historical price action tells a story of past battles between buyers and sellers. By identifying these zones, you can anticipate where future battles might occur and use that information to inform your trading decisions.
Here’s an analogy: Imagine a tug-of-war between two teams. The supply zone is like the point where the stronger team (sellers) previously stopped the weaker team (buyers) from pulling the rope further. The demand zone is where the weaker team (buyers) previously stopped the stronger team (sellers) from pulling the rope further. By identifying these points, you can predict where the rope might move next based on the relative strength of each team.
Main Types of Supply and Demand Zones
As we saw earlier, supply and demand zones represent areas on a price chart where historical price action reveals past clashes between buyers and sellers. But not all zones are created equal. Let’s delve deeper and differentiate between the two main types based on the underlying price action:
1. Supply Zones (Areas of Selling Pressure):
These zones form at the upper end of the price band and signify areas where there was an excess of sellers in the past. Here’s how to identify them based on price action:
Price Rejection: Look for areas where the price has attempted to move higher but has been repeatedly rejected. This rejection can take various forms, such as long upper shadows (wicks) on candlesticks or failed breakouts above the zone. These rejections indicate strong selling pressure pushing the price back down.
Decreasing Volume: As the price approaches the supply zone, often the volume (number of shares/contracts traded) will start to decrease. This suggests that the sellers who were initially dominant are becoming less active, but their presence is still strong enough to cap further price increases.
Distribution Patterns: In advanced technical analysis, specific price patterns like “Head and Shoulders” or “Descending Channels” can often form within supply zones. These patterns act as confirmations of the underlying selling pressure.
Essentially, supply zones scream “Sell!”. The repeated price rejections, decreasing volume, and potential bearish patterns all point towards a historical imbalance favoring sellers.
2. Demand Zones (Areas of Buying Pressure):
These zones form at the lower end of the price band and signify areas where there was an excess of buyers in the past. Here’s how to identify them based on price action:
Price Support: Look for areas where the price has attempted to move lower but has been repeatedly supported. This support can manifest as long lower shadows (wicks) on candlesticks or failed breakouts below the zone. These bounces indicate strong buying pressure pushing the price back up.
Increasing Volume: As the price approaches the demand zone, often the volume will start to increase. This suggests that buyers are becoming more active, ready to step in and purchase at these attractive lower prices.
Accumulation Patterns: Similar to supply zones, specific price patterns like “Ascending Triangles” or “Rounding Bottoms” can form within demand zones. These patterns act as confirmations of the underlying buying pressure.
In essence, demand zones whisper “Buy!”. The repeated price support, increasing volume, and potential bullish patterns all point towards a historical imbalance favoring buyers.
By understanding the distinct characteristics of supply and demand zones based on price action, you can develop a keen eye for identifying these crucial battlegrounds on the charts. This will allow you to anticipate potential future price movements and make informed trading decisions.
How to Draw Supply and Demand Zones?
Now that you can identify the key characteristics of supply and demand zones based on price action, it’s time to translate that knowledge into action on your charts. Here’s how to effectively draw these zones for optimal clarity and consistency:
1. Unleashing the Power of Horizontal Lines:
The primary tool for drawing supply and demand zones is the humble horizontal line. These lines will mark the upper and lower boundaries of the zone, highlighting the price levels where the historical battles between buyers and sellers took place.
2. Supply Zones – Marking the Seller’s Stronghold:
- Identify an area on the chart where the price has been rejected multiple times in the past, forming clear upper shadows (wicks) on candlesticks.
- Locate the highest point among these upper shadows. This will represent the upper boundary of the supply zone.
- Draw a horizontal line across the chart at this highest point. This line marks the price level where sellers historically stopped the price from rising further.
3. Demand Zones – Marking the Buyer’s Sanctuary:
- Identify an area on the chart where the price has found support multiple times in the past, forming clear lower shadows (wicks) on candlesticks.
- Locate the lowest point among these lower shadows. This will represent the lower boundary of the demand zone.
- Draw a horizontal line across the chart at this lowest point. This line marks the price level where buyers historically prevented the price from falling further.
4. Precision and Consistency are Key:
- Clarity matters: Strive for clean, well-defined horizontal lines. This ensures clear visualization of the zone boundaries.
- Consistency is king: Maintain consistency in how you draw these zones across different charts. This helps you develop a reliable and personalized interpretation method.
- Less is more: Don’t overcomplicate your chart with too many zones. Focus on identifying the most prominent and well-defined areas of supply and demand.
Remember: There’s no one-size-fits-all approach for drawing supply and demand zones. The “width” or thickness of the zone can vary depending on the time frame and the aggressiveness of past price action. With practice, you’ll develop your own eye for identifying the most relevant boundaries for your trading style.
By following these steps and emphasizing clarity and consistency, you’ll be well on your way to accurately marking these crucial battlegrounds on your charts. These zones will then become powerful tools in your trading arsenal, helping you anticipate potential price movements and make informed decisions.’
Best Trading Strategies for Supply and Demand Zones
Having mastered the art of identifying supply and demand zones on your charts, it’s time to translate that knowledge into actionable trading strategies. Here, we explore some fundamental approaches that leverage these historical battlegrounds for potential profit opportunities:
1. Buying at Support (Demand Zones):
Demand zones represent areas where buyers historically stepped in and prevented further price decline, creating a sense of support. Here’s how to utilize them for potential buying opportunities:
- Identify a well-defined demand zone on your chart using the techniques discussed earlier. These zones should exhibit clear price stalling or reversals at a specific level, potentially accompanied by increased buying volume.
- Look for price action confirmation before entering a long (buy) trade. This confirmation strengthens your conviction that the support level is still valid and helps avoid false breakouts. Examples of confirmation include:
- Price bouncing off the lower boundary of the zone with a bullish candlestick pattern (e.g., hammer, engulfing bullish).
- Price breaking above the zone with strong buying volume, indicating a potential breakout and trend continuation. This is a more aggressive entry, but can offer higher profit potential.
2. Selling at Resistance (Supply Zones):
Conversely, supply zones represent areas where sellers historically dominated and pushed the price back down, creating a sense of resistance. Here’s how to utilize them for potential selling opportunities:
- Identify a well-defined supply zone on your chart. These zones should exhibit clear price stalling or reversals at a specific level, potentially accompanied by increased selling volume.
- Look for price action confirmation before entering a short (sell) trade. Confirmation ensures the zone’s validity and helps avoid false breakdowns. Examples of confirmation include:
- Price rejecting the upper boundary of the zone with a bearish candlestick pattern (e.g., shooting star, bearish engulfing).
- Price breaking below the zone with strong selling volume, indicating a potential breakdown and trend continuation. This is a more aggressive entry, but can offer higher profit potential.
3. The Power of Price Action Confirmation:
Remember, price action confirmation is crucial before entering a trade based on supply and demand zones. Don’t blindly buy at support or sell at resistance. Markets are dynamic, and historical support/resistance levels can sometimes be broken. Confirmation ensures the zone is still relevant and helps you avoid false signals.
Beyond the Basics:
These strategies form the foundation for utilizing supply and demand zones in your trading. As you gain experience, consider incorporating these additional elements:
- Volume analysis: Volume spikes at these zones can further confirm the strength of buying or selling pressure.
- Combining with other indicators: Supply and demand zones can be used alongside technical indicators like moving averages or RSI for a more comprehensive trading strategy.
- Advanced zone identification: Explore concepts like “accumulation” and “distribution” patterns that can form within these zones, offering deeper insights.
By mastering these strategies and continuously refining your understanding of supply and demand zones, you’ll be well on your way to exploiting these battlegrounds for potential gains and navigating the ever-changing market landscape with greater confidence.
Supply and Demand Trading: Turning Battlegrounds into Active Strategies
Now that you understand how to identify supply and demand zones, let’s explore how to actively trade based on these historical imbalances.
Active Trading with Supply and Demand Zones:
These zones provide valuable insights into potential price movements, allowing active traders to:
- Position themselves for potential breakouts: By identifying well-defined zones, traders can anticipate areas where price might struggle or break through. They can then position themselves for long entries above resistance zones (breakouts) or short entries below support zones (breakdowns).
- Refine entry and exit points: Zones can help refine existing trading strategies. For example, a trader using a moving average crossover strategy can use the zone as confirmation for a long entry when the price breaks above a resistance zone with strong buying volume.
- Manage risk: Zones can help set stop-loss orders. For instance, a long trade based on support can have a stop-loss placed just below the support zone, limiting potential downside if the support breaks.
Advanced Concepts: Accumulation and Distribution Patterns
As you delve deeper into supply and demand trading, you’ll encounter advanced concepts like:
- Accumulation patterns: These specific chart patterns (e.g., ascending triangles, rounding bottoms) often form within demand zones, signifying a gradual increase in buying pressure before a potential price breakout.
- Distribution patterns: These specific chart patterns (e.g., head and shoulders, descending channels) often form within supply zones, signifying a gradual increase in selling pressure before a potential price breakdown.
Identifying these patterns within zones can further strengthen your trading conviction.
Pros and Cons of Supply and Demand Trading
Advantages:
- Relatively simple concept to grasp: Compared to complex technical indicators, the core concept of supply and demand zones is fairly straightforward.
- Applicable to various markets and timeframes: Supply and demand dynamics are universal, making the concept applicable to various markets (stocks, forex, commodities) and timeframes (daily, hourly, etc.).
Disadvantages:
- Requires practice to identify zones accurately: While the concept is simple, accurately identifying zones on charts takes practice and experience.
- Not a foolproof method and needs to be used with other analysis: Supply and demand zones are a powerful tool, but not a crystal ball. They should be used in conjunction with other technical indicators or fundamental analysis for a more well-rounded approach.
In conclusion, supply and demand trading empowers you to exploit the historical battles between buyers and sellers. By mastering zone identification, incorporating active trading strategies, and understanding both the advantages and limitations, you can transform these battlegrounds into opportunities for informed trading decisions. Remember, consistent practice and continuous learning are key to mastering this valuable approach.
For detailed insights to boost trading success, explore our website. Discover in-depth reviews of forex proprietary trading firms and stay updated with the latest trading news.